-
Water Grid
Storage Capacity Capacity
83.6%
Change-0.3%
last 7 days
-
Catchment Average
Rainfall
 Rainfall
14.2mm
-
Average
Daily Usage Avg Person
152L
Change-1L
last month
-
Water Grid
Storage Capacity
Capacity83.6%
Change-0.3%
last 7 days
-
Dam Levels as at 12:03am, 24 July 2026
- Cards
- Table
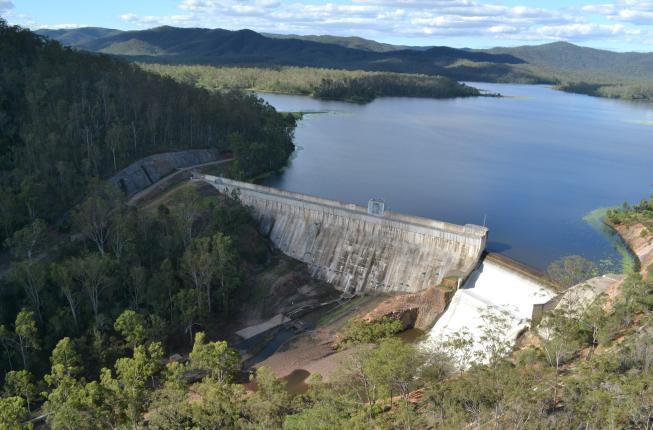
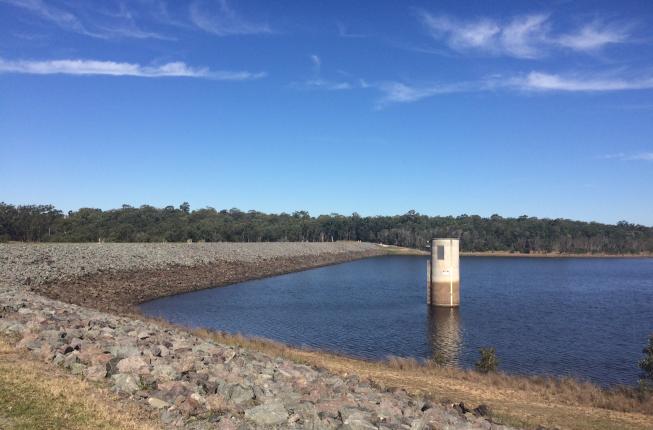
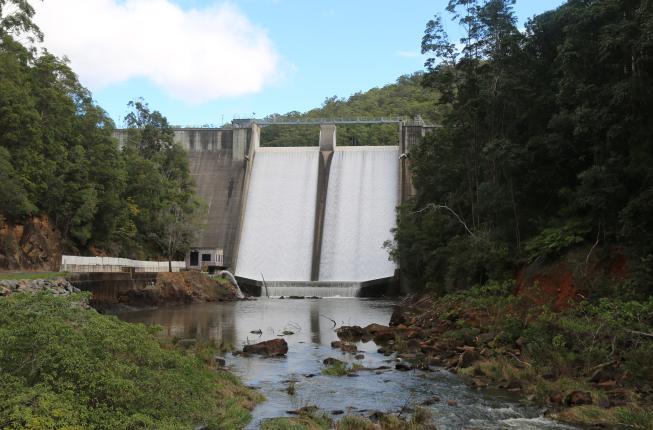
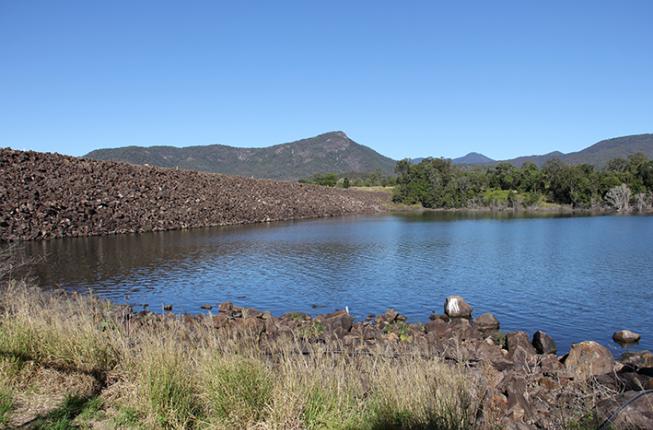
The following table provides the latest available information about the region's dams. Dam levels are updated regularly 24 hours a day. Please note: dam levels are based on automated data which has not been verified.
See updates on gated dam operations and spilling un-gated dams, or sign up for our free Dam Release Notification Service to receive alerts by email, SMS or recorded message to landline, as spilling or gated releases occur. For information about flood levels, contact your local Council. For information about road impacts, contact Transport and Main Roads. For information about river levels, please see the Bureau of Meteorology website.
Dam Full supply volume (ML) Current volume (ML) % Full Latest observation Comment Atkinson Historical levels 30, 401 ML 21, 561 ML 70.9% 12:00am 24/07/2026 Baroon Pocket Historical levels 61, 000 ML 60, 384 ML 99.0% 12:00am 24/07/2026 Bill Gunn (Lake Dyer) Historical levels 6, 947 ML 5, 580 ML 80.3% 12:00am 24/07/2026 Borumba Historical levels 46, 000 ML 45, 829 ML 99.6% 12:00am 24/07/2026 Cedar Pocket Historical levels 735 ML 728 ML 99.0% 8:36pm 23/07/2026 Clarendon Historical levels 24, 276 ML 19, 337 ML 79.7% 12:00am 24/07/2026 Cooloolabin Historical levels 8, 183 ML 7, 763 ML 94.9% 12:00am 24/07/2026 Enoggera Historical levels 4, 262 ML 4, 269 ML 100.2% 12:00am 24/07/2026 Dam is spilling Ewen Maddock Historical levels 16, 587 ML 16, 230 ML 97.8% 12:03am 24/07/2026 Gold Creek Historical levels 801 ML 675 ML 84.3% 12:00am 24/07/2026 Hinze Historical levels 310, 730 ML 309, 194 ML 99.5% 12:00am 24/07/2026 Lake Macdonald (Six Mile Creek) Historical levels 8, 018 ML 3, 147 ML 39.2% 12:01am 24/07/2026 Lake Manchester Historical levels 26, 217 ML 23, 492 ML 89.6% 12:00am 24/07/2026 Leslie Harrison Historical levels 13, 206 ML 11, 911 ML 90.2% 12:00am 24/07/2026 Little Nerang Historical levels 6, 705 ML 6, 662 ML 99.4% 12:00am 24/07/2026 Maroon Historical levels 44, 319 ML 44, 410 ML 100.2% 12:00am 24/07/2026 Dam is spilling Moogerah Historical levels 83, 765 ML 69, 405 ML 82.9% 12:00am 24/07/2026 Nindooinbah Historical levels 213 ML 204 ML 95.8% 12:00am 24/07/2026 North Pine (Lake Samsonvale) Historical levels 214, 302 ML 110, 635 ML 51.6% 10:00pm 23/07/2026 Poona Historical levels 655 ML 585 ML 89.3% 12:00am 24/07/2026 Sideling Creek (Lake Kurwongbah) Historical levels 14, 192 ML 14, 241 ML 100.3% 12:00am 24/07/2026 Dam is spilling Somerset Historical levels 379, 849 ML 302, 048 ML 79.5% 12:03am 24/07/2026 Wappa Historical levels 4, 694 ML 4, 710 ML 100.3% 12:00am 24/07/2026 Dam is spilling Wivenhoe Historical levels 1, 165, 240 ML 994, 908 ML 85.4% 12:00am 24/07/2026 Wyaralong Historical levels 102, 883 ML 100, 729 ML 97.9% 12:00am 24/07/2026 -
70.9%Last observation: 12:00am 24/07/2026View historical dam levels
-
99.0%Last observation: 12:00am 24/07/2026
-
80.3%Last observation: 12:00am 24/07/2026
-
99.6%Last observation: 12:00am 24/07/2026
-
99.0%Last observation: 8:36pm 23/07/2026
-
79.7%Last observation: 12:00am 24/07/2026
-
94.9%Last observation: 12:00am 24/07/2026
-
100.2%Last observation: 12:00am 24/07/2026Dam is spillingView historical dam levels
-
97.8%Last observation: 12:03am 24/07/2026
-
84.3%Last observation: 12:00am 24/07/2026
-
99.5%Last observation: 12:00am 24/07/2026
-
39.2%Last observation: 12:01am 24/07/2026
-
89.6%Last observation: 12:00am 24/07/2026
-
90.2%Last observation: 12:00am 24/07/2026
-
99.4%Last observation: 12:00am 24/07/2026
-
100.2%Last observation: 12:00am 24/07/2026Dam is spillingView historical dam levels
-
82.9%Last observation: 12:00am 24/07/2026
-
95.8%Last observation: 12:00am 24/07/2026
-
51.6%Last observation: 10:00pm 23/07/2026
-
89.3%Last observation: 12:00am 24/07/2026
-
100.3%Last observation: 12:00am 24/07/2026Dam is spillingView historical dam levels
-
79.5%Last observation: 12:03am 24/07/2026
-
100.3%Last observation: 12:00am 24/07/2026Dam is spillingView historical dam levels
-
85.4%Last observation: 12:00am 24/07/2026
-
97.9%Last observation: 12:00am 24/07/2026
-
Full supply volume 30, 401 MLCurrent volume 21, 561 ML% Full 70.9%Latest observation 12:00am 24/07/2026
-
Full supply volume 61, 000 MLCurrent volume 60, 384 ML% Full 99.0%Latest observation 12:00am 24/07/2026
-
Full supply volume 6, 947 MLCurrent volume 5, 580 ML% Full 80.3%Latest observation 12:00am 24/07/2026
-
Full supply volume 46, 000 MLCurrent volume 45, 829 ML% Full 99.6%Latest observation 12:00am 24/07/2026
-
Full supply volume 735 MLCurrent volume 728 ML% Full 99.0%Latest observation 8:36pm 23/07/2026
-
Full supply volume 24, 276 MLCurrent volume 19, 337 ML% Full 79.7%Latest observation 12:00am 24/07/2026
-
Full supply volume 8, 183 MLCurrent volume 7, 763 ML% Full 94.9%Latest observation 12:00am 24/07/2026
-
Full supply volume 4, 262 MLCurrent volume 4, 269 ML% Full 100.2%Latest observation 12:00am 24/07/2026Comment Dam is spilling
-
Full supply volume 16, 587 MLCurrent volume 16, 230 ML% Full 97.8%Latest observation 12:03am 24/07/2026
-
Full supply volume 801 MLCurrent volume 675 ML% Full 84.3%Latest observation 12:00am 24/07/2026
-
Full supply volume 310, 730 MLCurrent volume 309, 194 ML% Full 99.5%Latest observation 12:00am 24/07/2026
-
Full supply volume 8, 018 MLCurrent volume 3, 147 ML% Full 39.2%Latest observation 12:01am 24/07/2026
-
Full supply volume 26, 217 MLCurrent volume 23, 492 ML% Full 89.6%Latest observation 12:00am 24/07/2026
-
Full supply volume 13, 206 MLCurrent volume 11, 911 ML% Full 90.2%Latest observation 12:00am 24/07/2026
-
Full supply volume 6, 705 MLCurrent volume 6, 662 ML% Full 99.4%Latest observation 12:00am 24/07/2026
-
Full supply volume 44, 319 MLCurrent volume 44, 410 ML% Full 100.2%Latest observation 12:00am 24/07/2026Comment Dam is spilling
-
Full supply volume 83, 765 MLCurrent volume 69, 405 ML% Full 82.9%Latest observation 12:00am 24/07/2026
-
Full supply volume 213 MLCurrent volume 204 ML% Full 95.8%Latest observation 12:00am 24/07/2026
-
Full supply volume 214, 302 MLCurrent volume 110, 635 ML% Full 51.6%Latest observation 10:00pm 23/07/2026
-
Full supply volume 655 MLCurrent volume 585 ML% Full 89.3%Latest observation 12:00am 24/07/2026
-
Full supply volume 14, 192 MLCurrent volume 14, 241 ML% Full 100.3%Latest observation 12:00am 24/07/2026Comment Dam is spilling
-
Full supply volume 379, 849 MLCurrent volume 302, 048 ML% Full 79.5%Latest observation 12:03am 24/07/2026
-
Full supply volume 4, 694 MLCurrent volume 4, 710 ML% Full 100.3%Latest observation 12:00am 24/07/2026Comment Dam is spilling
-
Full supply volume 1, 165, 240 MLCurrent volume 994, 908 ML% Full 85.4%Latest observation 12:00am 24/07/2026
-
Full supply volume 102, 883 MLCurrent volume 100, 729 ML% Full 97.9%Latest observation 12:00am 24/07/2026
Note: Full supply capacity does not include the entire flood storage compartments of Wivenhoe and Somerset dams.
The current flood storage capacityCatchment Average
Rainfall
Rainfall14.2mm
Rainfall as at Thursday, 23 July 2026
The rainfall values reported below are the catchment average rainfall values recorded across Seqwater’s dam catchments, over a 7 day rolling period.
Rainfall values are updated daily.
Please note: rainfall values are based on automated data which has not been verified.
Dam Current drinking
water volume (ML)% full Change in volume
past 7 days (%)Catchment average rainfall
past 7 days (mm)Baroon Pocket 60, 384 ML 99.0% -0.2 19.1 Cooloolabin 7, 763 ML 94.9% -0.4 10.6 Ewen Maddock 16, 230 ML 97.8% -0.5 11.9 Hinze 309, 194 ML 99.5% -0.2 36.0 Lake Macdonald (Six Mile Creek) 3, 147 ML 39.2% -0.5 19.9 Leslie Harrison 11, 911 ML 90.2% -2.1 19.3 Little Nerang 6, 662 ML 99.4% -0.6 36.0 North Pine (Lake Samsonvale) 110, 635 ML 51.6% -0.3 5.3 Sideling Creek (Lake Kurwongbah) 14, 241 ML 100.3% -0.2 7.9 Somerset 302, 048 ML 79.5% -0.1 7.1 Wappa 4, 710 ML 100.3% +0.1 10.6 Wivenhoe 994, 908 ML 85.4% -0.5 4.6 Average
Daily Usage
Avg Person152L
Change-1L
last month
Usage as at Wednesday, 24 June 2026
Average residential usage information is updated monthly. Consumption data is published on the first Wednesday of every month.
Water consumption summary for the 28 day period ending Wednesday, 24 June 2026
Zone Daily Production (ML) Daily Per Capita Consumption (L/p/d) Total Rainfall (mm) Average Max Daily Temperature (°C) SEQ Service Provider Monthly LPD Report 883 152 City of Gold Coast 173 166 120.0 22.3 Logan City Council 73 145 86.0 22.3 Redland City Council 39 176 144.6 21.6 Unitywater 184 144 81.0 22.5 Urban Utilities 415 151 96.4 22.7 Residential water consumption for similar time last year (28 day period ending 25 June 2025)
Zone SEQ City of Gold Coast Logan City Council Redland City Council Unitywater Urban Utilities Average daily residential consumption (L/person) 157 164 170 177 151 152

Emergency contacts
This overlay provides a list of useful emergency phone numbers.
For all life threatening emergencies
phone Police, Fire Brigade, or Ambulance
Do you need assistance from your local SES members?
State Emergency Service
Are there burst pipes in your area?
Have you lost water supply to your home, are there taste and odor issues with your drinking water?
Are there roads flooded, or localised flooding in your area?