PFAS and drinking water
Our water meets the Australian Drinking Water Guidelines
Providing clean, safe drinking water is Seqwater’s number one priority and South East Queensland’s drinking water continues to meet the standards set by the Australian Drinking Water Guidelines (ADWG).
PFAS
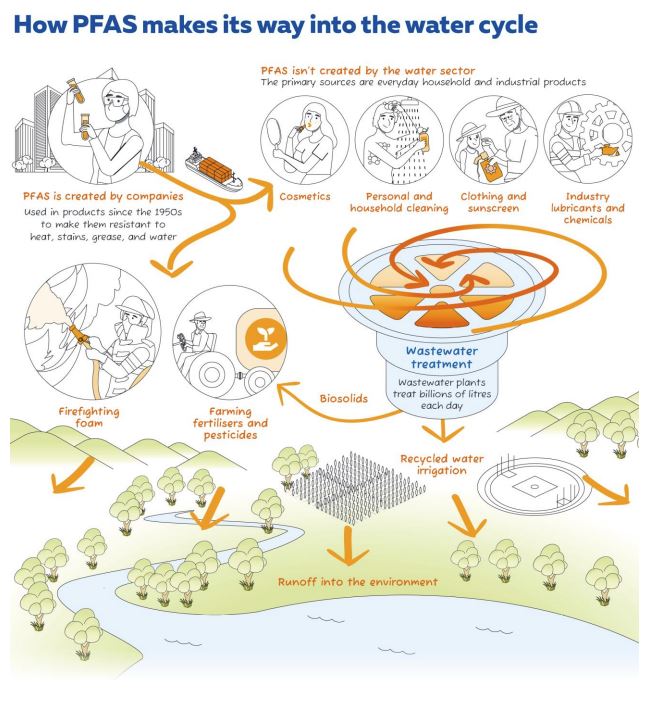
PFAS (per- and polyfluoroalkyl substances) are a group of human-made chemicals that have been widely used in industrial and consumer products since the mid-1900s.
Due to the unique physical and chemical properties of PFAS to resist heat, stains, grease and water, they have been used in items including firefighting foams, agricultural, textiles and leather products, food packaging, non-stick cookware, cosmetics, sunscreens, denture cleaner and medical devices.
Because PFAS are difficult to break down, they are sometimes referred to as forever chemicals.
Monitoring
We regularly test for PFAS to meet the national standards set by the ADWG and as part of our compliance with the Seqwater Drinking Water Quality Management Plan (approved by the Queensland Government Water Supply Regulator) and a safety-focused approach to the management of drinking water quality.
There are thousands of PFAS compounds and Seqwater tests for those that are most commonly found through our monitoring programs. On this page, Seqwater publicly reports on the four PFAS listed in the Australian Drinking Water Guidelines (ADWG), as these are the compounds that have health‑based guidance in Australia. However, our testing can pick up other types of PFAS and we report on these in our annual drinking water reports.

PFAS Guidelines
The Australian Drinking Water Guidelines (ADWG) are set by the National Health and Medical Research Council (NHMRC) and provide guidance to water regulators and suppliers on monitoring and managing drinking water quality.
PFAS chemicals enter our waterways from external sources and are not added to drinking water. The NHMRC note that exposure to PFAS can occur through many pathways including consumer products, food packaging, air, dust and drinking water.
Although, exposure to PFOS and PFOA from drinking water has been previously estimated to be approximately 2-3% of total exposure to PFAS1 in areas with low levels of contamination.
The importation of PFAS in Australia has been reduced since 2002 and the Australian Government has prohibited the import, manufacture and export of PFOA, PFOS and PFHxS from 1 July 2025.
1 Thompson J, Eaglesham G, Mueller J (2011). Concentrations of PFOS, PFOA and other perfluorinated alkyl acids in Australian drinking water. Chemosphere 83; 1320-1325.
Australia has ADWG guidance for four PFAS compounds
The ADWG for PFAS was updated by the NHMRC in June 2025 in line with the latest scientific data to maintain clean, safe drinking water.
Following the release of the draft guidelines and a public consultation period in 2024, the new guidelines include lower levels for three types of PFAS (PFOS, PFOA and PFHxS) and the introduction of a limit for PFBS.
The ADWG specifies a limit for perfluorooctanoic acid (PFOA) of 0.2 µg/L (micrograms per litre). This may also be expressed as 200 ng/L (nanograms per litre), which equates to 200 parts per trillion.
It specifies a limit for perfluorooctane sulfonate acid (PFOS) of 0.008 µg/L (micrograms per litre). This may also be expressed as 8 ng/L (nanograms per litre), which equates to 8 parts per trillion.
It specifics a limit for perfluorohexane sulfonate acid (PFHxS) of 0.03 µg/L (micrograms per litre). This may also be expressed as 30 ng/L (nanograms per litre), which equates to 30 parts per trillion.
It also specifies a limit for perfluorobutane sulfonic acid (PFBS) of 1.0 µg/L (micrograms per litre). This may also be expressed as 1000 ng/L (nanograms per litre), which equates to 1000 parts per trillion.
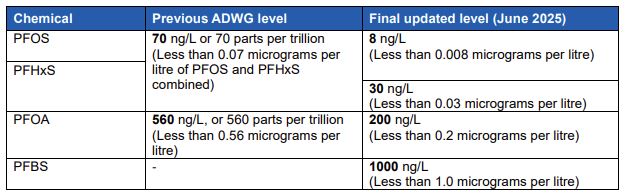
Source: Water Services Association Australia (WSAA) fact sheet - PFAS and the water sector, June 2025.
For more information, visit:

 Testing for PFAS
We live and work in the region, drink the same water and are committed to the continued delivery of clean, safe and valued drinking water.
We regularly monitor for PFAS in our region’s drinking water supplies, including:
- Twice-yearly region-wide raw water monitoring mostly via highly sensitive passive sampling technology. Testing is typically conducted in January and February (summer) and July and August (winter). We aim to publish results on our website within three months after testing is complete. This is determined by the collection and validation of independent laboratories.
- Monthly raw and treated drinking water monitoring via grab sampling at the Mount Crosby, Capalaba and Lowood Water Treatment Plants.
The drinking water in South East Queensland continues to remain safe to drink and our enhanced monitoring program will continue to help to inform our understanding of the presence of PFAS and ongoing risk assessments as required.
Results
South East Queensland’s drinking water is safe to drink and meets the updated ADWG for PFAS.
Our water quality experts and scientists manage our drinking water with great care and attention and ensure that it meets the standards set nationally by the health professionals.
While small amounts of PFAS have been detected in our region’s water supplies, the current guidelines are the equivalent of approximately one drop of PFOS in around three Olympic-sized swimming pools and around half a teaspoon of PFBS in an Olympic-sized swimming pool.
June 2026 Raw and Treated Drinking Water Monthly Grab Sampling Results
Overview of results: All results for PFAS are below the old and updated ADWG for PFAS.
| Sample Month | Water Treatment Plant (WTP) | PFOS (ng/L) | PFHxS (ng/L) | PFOA (ng/L) |
|---|---|---|---|---|
| Raw Water Sample | ADWG (PFOS + PFHxS) value: 70 | ADWG value: 560 | ||
| June 2026 | Capalaba WTP | <0.2 | <0.2 | <0.2 |
| June 2026 | Lowood WTP | <0.2 | <0.2 | <0.2 |
| June 2026 | Mt Crosby East Bank WTP | <0.2 | <0.2 | <0.2 |
| June 2026 | Mt Crosby West Bank WTP | <0.2 | <0.2 | <0.2 |
| Treated Water Sample | ADWG (PFOS + PFHxS) value: 70 | ADWG value: 560 | ||
| June 2026 | Capalaba WTP | <0.2 | <0.2 | <0.2 |
| June 2026 | Lowood WTP | <0.2 | <0.2 | <0.2 |
| June 2026 | Mt Crosby WTP – Camerons Hill 1 | <0.2 | <0.2 | <0.2 |
| June 2026 | Mt Crosby WTP – Camerons Hill 2 | <0.2 | <0.2 | <0.2 |
Updated ADWG for PFAS
| Sample Month | Water Treatment Plant (WTP) | PFOS (ng/L) | PFHxS (ng/L) | PFOA (ng/L) | PFBS (ng/L) |
|---|---|---|---|---|---|
| Raw Water Sample | ADWG value: 8 ng/L | ADWG value: 30 ng/L | ADWG value: 200 ng/L | ADWG value: 1000 ng/L | |
| June 2026 | Capalaba WTP | <0.2 | <0.2 | <0.2 | 0.5 |
| June 2026 | Lowood WTP | <0.2 | <0.2 | <0.2 | <0.2 |
| June 2026 | Mt Crosby East Bank WTP | <0.2 | <0.2 | <0.2 | <0.2 |
| June 2026 | Mt Crosby West Bank WTP | <0.2 | <0.2 | <0.2 | <0.2 |
| Treated Water Sample | ADWG value: 8 ng/L | ADWG value: 30 ng/L | ADWG value: 200 ng/L | ADWG value: 1000 ng/L | |
| June 2026 | Capalaba WTP | <0.2 | <0.2 | <0.2 | 0.4 |
| June 2026 | Lowood WTP | <0.2 | <0.2 | <0.2 | <0.2 |
| June 2026 | Mt Crosby WTP – Camerons Hill 1 | <0.2 | <0.2 | <0.2 | 0.2 |
| June 2026 | Mt Crosby WTP – Camerons Hill 2 | <0.2 | <0.2 | <0.2 | <0.2 |
May 2026 Raw and Treated Drinking Water Monthly Grab Sampling Results
Overview of results: All results for PFAS are below the old and updated ADWG for PFAS.
| Sample Month | Water Treatment Plant (WTP) | PFOS (ng/L) | PFHxS (ng/L) | PFOA (ng/L) |
|---|---|---|---|---|
| Raw Water Sample | ADWG (PFOS + PFHxS) value: 70 | ADWG value: 560 | ||
| May 2026 | Capalaba WTP | 1.4 | 0.8 | 1.0 |
| May 2026 | Lowood WTP | <0.2 | <0.2 | <0.2 |
| May 2026 | Mt Crosby East Bank WTP | <0.2 | <0.2 | <0.2 |
| May 2026 | Mt Crosby Westbank WTP | <0.2 | <0.2 | <0.2 |
| Treated Water Sample | ADWG (PFOS + PFHxS) value: 70 | ADWG value: 560 | ||
| May 2026 | Capalaba WTP | 1.2 | 0.7 | 1.0 |
| May 2026 | Lowood WTP | <0.2 | <0.2 | <0.2 |
| May 2026 | Mt Crosby WTP – Camerons Hill 1 | <0.2 | <0.2 | <0.2 |
| May 2026 | Mt Crosby WTP – Camerons Hill 2 | <0.2 | <0.2 | <0.2 |
Updated ADWG for PFAS
| Sample Month | Water Treatment Plant (WTP) | PFOS (ng/L) | PFHxS (ng/L) | PFOA (ng/L) | PFBS (ng/L) |
|---|---|---|---|---|---|
| Raw Water Sample | ADWG value: 8 ng/L | ADWG value: 30 ng/L | ADWG value: 200 ng/L | ADWG value: 1000 ng/L | |
| May 2026 | Capalaba WTP | 1.4 | 0.8 | 1.0 | 0.5 |
| May 2026 | Lowood WTP | <0.2 | <0.2 | <0.2 | <0.2 |
| May 2026 | Mt Crosby East Bank WTP | <0.2 | <0.2 | <0.2 | <0.2 |
| May 2026 | Mt Crosby Westbank WTP | <0.2 | <0.2 | <0.2 | <0.2 |
| Treated Water Sample | ADWG value: 8 ng/L | ADWG value: 30 ng/L | ADWG value: 200 ng/L | ADWG value: 1000 ng/L | |
| May 2026 | Capalaba WTP | 1.2 | 0.7 | 1.0 | 0.4 |
| May 2026 | Lowood WTP | <0.2 | <0.2 | <0.2 | <0.2 |
| May 2026 | Mt Crosby WTP – Camerons Hill 1 | <0.2 | <0.2 | <0.2 | <0.2 |
| May 2026 | Mt Crosby WTP – Camerons Hill 2 | <0.2 | <0.2 | <0.2 | <0.2 |
April 2026 Raw and Treated Drinking Water Monthly Grab Sampling Results
Overview of results: All results for PFAS are below the old and updated ADWG for PFAS.
| Sample Month | Water Treatment Plant (WTP) | PFOS (ng/L) | PFHxS (ng/L) | PFOA (ng/L) |
|---|---|---|---|---|
| Raw Water Sample | ADWG (PFOS + PFHxS) value: 70 | ADWG value: 560 | ||
| April 2026 | Capalaba WTP | 2.5 | 0.9 | 1.5 |
| April 2026 | Lowood WTP | <0.2 | <0.2 | <0.2 |
| April 2026 | Mt Crosby East Bank WTP | <0.2 | <0.2 | <0.2 |
| April 2026 | Mt Crosby Westbank WTP | <0.2 | <0.2 | <0.2 |
| Treated Water Sample | ADWG (PFOS + PFHxS) value: 70 | ADWG value: 560 | ||
| April 2026 | Capalaba WTP | 1.5 | 0.8 | 1.0 |
| April 2026 | Lowood WTP | <0.2 | <0.2 | <0.2 |
| April 2026 | Mt Crosby WTP – Camerons Hill 1 | <0.2 | <0.2 | <0.2 |
| April 2026 | Mt Crosby WTP – Camerons Hill 2 | <0.2 | <0.2 | <0.2 |
Updated ADWG for PFAS
| Sample Month | Water Treatment Plant (WTP) | PFOS (ng/L) | PFHxS (ng/L) | PFOA (ng/L) | PFBS (ng/L) |
|---|---|---|---|---|---|
| Raw Water Sample | ADWG value: 8 ng/L | ADWG value: 30 ng/L | ADWG value: 200 ng/L | ADWG value: 1000 ng/L | |
| April 2026 | Capalaba WTP | 2.5 | 0.9 | 1.5 | 0.5 |
| April 2026 | Lowood WTP | <0.2 | <0.2 | <0.2 | 0.2 |
| April 2026 | Mt Crosby East Bank WTP | <0.2 | <0.2 | <0.2 | 0.2 |
| April 2026 | Mt Crosby Westbank WTP | <0.2 | <0.2 | <0.2 | 0.2 |
| Treated Water Sample | ADWG value: 8 ng/L | ADWG value: 30 ng/L | ADWG value: 200 ng/L | ADWG value: 1000 ng/L | |
| April 2026 | Capalaba WTP | 1.5 | 0.8 | 1.0 | 0.4 |
| April 2026 | Lowood WTP | <0.2 | <0.2 | <0.2 | <0.2 |
| April 2026 | Mt Crosby WTP – Camerons Hill 1 | <0.2 | <0.2 | <0.2 | 0.2 |
| April 2026 | Mt Crosby WTP – Camerons Hill 2 | <0.2 | <0.2 | <0.2 | <0.2 |
March 2026 Raw and Treated Drinking Water Monthly Grab Sampling Results
Overview of results: All results for PFAS are below the old and updated ADWG for PFAS.
| Sample Month | Water Treatment Plant (WTP) | PFOS (ng/L) | PFHxS (ng/L) | PFOA (ng/L) |
|---|---|---|---|---|
| Raw Water Sample | ADWG (PFOS + PFHxS) value: 70 | ADWG value: 560 | ||
| March 2026 | Capalaba WTP | 2.6 | 0.9 | 1.7 |
| March 2026 | Lowood WTP | <0.2 | <0.2 | 0.2 |
| March 2026 | Mt Crosby East Bank WTP | <0.2 | <0.2 | <0.2 |
| March 2026 | Mt Crosby Westbank WTP | <0.2 | <0.2 | 0.2 |
| Treated Water Sample | ADWG (PFOS + PFHxS) value: 70 | ADWG value: 560 | ||
| March 2026 | Capalaba WTP | 1.7 | 0.9 | 1.3 |
| March 2026 | Lowood WTP | <0.2 | <0.2 | 0.4 |
| March 2026 | Mt Crosby WTP – Camerons Hill 1 | <0.2 | <0.2 | 0.2 |
| March 2026 | Mt Crosby WTP – Camerons Hill 2 | <0.2 | <0.2 | 0.2 |
Updated ADWG for PFAS
| Sample Month | Water Treatment Plant (WTP) | PFOS (ng/L) | PFHxS (ng/L) | PFOA (ng/L) | PFBS (ng/L) |
|---|---|---|---|---|---|
| Raw Water Sample | ADWG value: 8 ng/L | ADWG value: 30 ng/L | ADWG value: 200 ng/L | ADWG value: 1000 ng/L | |
| March 2026 | Capalaba WTP | 2.6 | 0.9 | 1.7 | 0.5 |
| March 2026 | Lowood WTP | <0.2 | <0.2 | 0.2 | 0.2 |
| March 2026 | Mt Crosby East Bank WTP | <0.2 | <0.2 | <0.2 | <0.2 |
| March 2026 | Mt Crosby Westbank WTP | <0.2 | <0.2 | 0.2 | <0.2 |
| Treated Water Sample | ADWG value: 8 ng/L | ADWG value: 30 ng/L | ADWG value: 200 ng/L | ADWG value: 1000 ng/L | |
| March 2026 | Capalaba WTP | 1.7 | 0.9 | 1.3 | 0.5 |
| March 2026 | Lowood WTP | <0.2 | <0.2 | 0.4 | 0.2 |
| March 2026 | Mt Crosby WTP – Camerons Hill 1 | <0.2 | <0.2 | 0.2 | 0.2 |
| March 2026 | Mt Crosby WTP – Camerons Hill 2 | <0.2 | <0.2 | 0.2 | 0.2 |
February 2026 Raw and Treated Drinking Water Monthly Grab Sampling Results
Overview of results: All results for PFAS are below the old and updated ADWG for PFAS.
| Sample Month | Water Treatment Plant (WTP) | PFOS (ng/L) | PFHxS (ng/L) | PFOA (ng/L) |
|---|---|---|---|---|
| Raw Water Sample | ADWG (PFOS + PFHxS) value: 70 | ADWG value: 560 | ||
| February 2026 | Capalaba WTP | <0.2 | <0.2 | 1.1 |
| February 2026 | Lowood WTP | <0.2 | <0.2 | <0.2 |
| February 2026 | Mt Crosby East Bank WTP | <0.2 | <0.2 | <0.2 |
| February 2026 | Mt Crosby Westbank WTP | <0.2 | <0.2 | <0.2 |
| Treated Water Sample | ADWG (PFOS + PFHxS) value: 70 | ADWG value: 560 | ||
| February 2026 | Capalaba WTP | <0.2 | <0.2 | 0.9 |
| February 2026 | Lowood WTP | <0.2 | <0.2 | <0.2 |
| February 2026 | Mt Crosby WTP – Camerons Hill 1 | <0.2 | <0.2 | <0.2 |
| February 2026 | Mt Crosby WTP – Camerons Hill 2 | <0.2 | <0.2 | <0.2 |
Updated ADWG for PFAS
| Sample Month | Water Treatment Plant (WTP) | PFOS (ng/L) | PFHxS (ng/L) | PFOA (ng/L) | PFBS (ng/L) |
|---|---|---|---|---|---|
| Raw Water Sample | ADWG value: 8 ng/L | ADWG value: 30 ng/L | ADWG value: 200 ng/L | ADWG value: 1000 ng/L | |
| February 2026 | Capalaba WTP | <0.2 | <0.2 | 1.1 | <0.2 |
| February 2026 | Lowood WTP | <0.2 | <0.2 | <0.2 | <0.2 |
| February 2026 | Mt Crosby East Bank WTP | <0.2 | <0.2 | <0.2 | <0.2 |
| February 2026 | Mt Crosby Westbank WTP | <0.2 | <0.2 | <0.2 | <0.2 |
| Treated Water Sample | ADWG value: 8 ng/L | ADWG value: 30 ng/L | ADWG value: 200 ng/L | ADWG value: 1000 ng/L | |
| February 2026 | Capalaba WTP | <0.2 | <0.2 | 0.9 | <0.2 |
| February 2026 | Lowood WTP | <0.2 | <0.2 | <0.2 | <0.2 |
| February 2026 | Mt Crosby WTP – Camerons Hill 1 | <0.2 | <0.2 | <0.2 | <0.2 |
| February 2026 | Mt Crosby WTP – Camerons Hill 2 | <0.2 | <0.2 | <0.2 | <0.2 |
January 2026 Raw and Treated Drinking Water Monthly Grab Sampling Results
Overview of results: All results for PFAS are below the old and updated ADWG for PFAS.
Old ADWG for PFAS
| Sample Month | Water Treatment Plant (WTP) | PFOS (ng/L) | PFHxS (ng/L) | PFOA (ng/L) |
|---|---|---|---|---|
| Raw Water Sample | ADWG (PFOS + PFHxS) value: 70 | ADWG value: 560 | ||
| January 2026 | Capalaba WTP | <0.2 | <0.2 | 0.3 |
| January 2026 | Lowood WTP | <0.2 | <0.2 | <0.2 |
| January 2026 | Mt Crosby East Bank WTP | <0.2 | <0.2 | <0.2 |
| January 2026 | Mt Crosby Westbank WTP | <0.2 | <0.2 | <0.2 |
| Treated Water Sample | ADWG (PFOS + PFHxS) value: 70 | ADWG value: 560 | ||
| January 2026 | Capalaba WTP | <0.2 | <0.2 | 0.4 |
| January 2026 | Lowood WTP | <0.2 | <0.2 | <0.2 |
| January 2026 | Mt Crosby WTP – Camerons Hill 1 | <0.2 | <0.2 | <0.2 |
| January 2026 | Mt Crosby WTP – Camerons Hill 2 | <0.2 | <0.2 | <0.2 |
Updated ADWG for PFAS
| Sample Month | Water Treatment Plant (WTP) | PFOS (ng/L) | PFHxS (ng/L) | PFOA (ng/L) | PFBS (ng/L) |
|---|---|---|---|---|---|
| Raw Water Sample | ADWG value: 8 ng/L | ADWG value: 30 ng/L | ADWG value: 200 ng/L | ADWG value: 1000 ng/L | |
| January 2026 | Capalaba WTP | <0.2 | <0.2 | 0.3 | <0.2 |
| January 2026 | Lowood WTP | <0.2 | <0.2 | <0.2 | <0.2 |
| January 2026 | Mt Crosby East Bank WTP | <0.2 | <0.2 | <0.2 | <0.2 |
| January 2026 | Mt Crosby Westbank WTP | <0.2 | <0.2 | <0.2 | <0.2 |
| Treated Water Sample | ADWG value: 8 ng/L | ADWG value: 30 ng/L | ADWG value: 200 ng/L | ADWG value: 1000 ng/L | |
| January 2026 | Capalaba WTP | <0.2 | <0.2 | 0.4 | <0.2 |
| January 2026 | Lowood WTP | <0.2 | <0.2 | <0.2 | <0.2 |
| January 2026 | Mt Crosby WTP – Camerons Hill 1 | <0.2 | <0.2 | <0.2 | <0.2 |
| January 2026 | Mt Crosby WTP – Camerons Hill 2 | <0.2 | <0.2 | <0.2 | <0.2 |
December 2025 Raw and Treated Drinking Water Monthly Grab Sampling Results
Overview of results: All results for PFAS are below the old and updated ADWG for PFAS.
Old ADWG for PFAS
| Sample Month | Water Treatment Plant (WTP) | PFOS (ng/L) | PFHxS (ng/L) | PFOA (ng/L) |
|---|---|---|---|---|
| Raw Water Sample | ADWG (PFOS + PFHxS) value: 70 | ADWG value: 560 | ||
| December 2025 | Capalaba WTP | 2.3 | 0.6 | 1.4 |
| December 2025 | Lowood WTP | <0.2 | <0.2 | <0.2 |
| December 2025 | Mt Crosby East Bank WTP | <0.2 | <0.2 | <0.2 |
| December 2025 | Mt Crosby Westbank WTP | <0.2 | <0.2 | <0.2 |
| Treated Water Sample | ADWG (PFOS + PFHxS) value: 70 | ADWG value: 560 | ||
| December 2025 | Capalaba WTP | 1.4 | 0.6 | 1.1 |
| December 2025 | Lowood WTP | <0.2 | <0.2 | <0.2 |
| December 2025 | Mt Crosby WTP – Camerons Hill 1 | <0.2 | <0.2 | <0.2 |
| December 2025 | Mt Crosby WTP – Camerons Hill 2 | <0.2 | <0.2 | <0.2 |
Updated ADWG for PFAS
| Sample Month | Water Treatment Plant (WTP) | PFOS (ng/L) | PFHxS (ng/L) | PFOA (ng/L) | PFBS (ng/L) |
|---|---|---|---|---|---|
| Raw Water Sample | ADWG value: 8 ng/L | ADWG value: 30 ng/L | ADWG value: 200 ng/L | ADWG value: 1000 ng/L | |
| December 2025 | Capalaba WTP | 2.3 | 0.6 | 1.4 | 0.5 |
| December 2025 | Lowood WTP | <0.2 | <0.2 | <0.2 | <0.2 |
| December 2025 | Mt Crosby East Bank WTP | <0.2 | <0.2 | <0.2 | <0.2 |
| December 2025 | Mt Crosby Westbank WTP | <0.2 | <0.2 | <0.2 | <0.2 |
| Treated Water Sample | ADWG value: 8 ng/L | ADWG value: 30 ng/L | ADWG value: 200 ng/L | ADWG value: 1000 ng/L | |
| December 2025 | Capalaba WTP | 1.4 | 0.6 | 1.1 | 0.4 |
| December 2025 | Lowood WTP | <0.2 | <0.2 | <0.2 | <0.2 |
| December 2025 | Mt Crosby WTP – Camerons Hill 1 | <0.2 | <0.2 | <0.2 | <0.2 |
| December 2025 | Mt Crosby WTP – Camerons Hill 2 | <0.2 | <0.2 | <0.2 | <0.2 |
November 2025 Raw and Treated Drinking Water Monthly Grab Sampling Results
Overview of results: All results for PFAS are below the old and updated ADWG for PFAS.
Old ADWG for PFAS
| Sample Month | Water Treatment Plant (WTP) | PFOS (ng/L) | PFHxS (ng/L) | PFOA (ng/L) |
|---|---|---|---|---|
| Raw Water Sample | ADWG (PFOS + PFHxS) value: 70 | ADWG value: 560 | ||
| November 2025 | Capalaba WTP | 3.5 | 1.0 | 1.5 |
| November 2025 | Lowood WTP | <0.2 | <0.2 | <0.2 |
| November 2025 | Mt Crosby East Bank WTP | <0.2 | <0.2 | <0.2 |
| November 2025 | Mt Crosby Westbank WTP | <0.2 | <0.2 | <0.2 |
| Treated Water Sample | ADWG (PFOS + PFHxS) value: 70 | ADWG value: 560 | ||
| November 2025 | Capalaba WTP | 1.4 | 0.8 | 1.0 |
| November 2025 | Lowood WTP | <0.2 | <0.2 | <0.2 |
| November 2025 | Mt Crosby WTP – Camerons Hill 1 | <0.2 | <0.2 | <0.2 |
| November 2025 | Mt Crosby WTP – Camerons Hill 2 | <0.2 | <0.2 | <0.2 |
Updated ADWG for PFAS
| Sample Month | Water Treatment Plant (WTP) | PFOS (ng/L) | PFHxS (ng/L) | PFOA (ng/L) | PFBS (ng/L) |
|---|---|---|---|---|---|
| Raw Water Sample | ADWG value: 8 ng/L | ADWG value: 30 ng/L | ADWG value: 200 ng/L | ADWG value: 1000 ng/L | |
| November 2025 | Capalaba WTP | 3.5 | 1.0 | 1.5 | <0.2 |
| November 2025 | Lowood WTP | <0.2 | <0.2 | <0.2 | <0.2 |
| November 2025 | Mt Crosby East Bank WTP | <0.2 | <0.2 | <0.2 | <0.2 |
| November 2025 | Mt Crosby Westbank WTP | <0.2 | <0.2 | <0.2 | <0.2 |
| Treated Water Sample | ADWG value: 8 ng/L | ADWG value: 30 ng/L | ADWG value: 200 ng/L | ADWG value: 1000 ng/L | |
| November 2025 | Capalaba WTP | 1.4 | 0.8 | 1.0 | <0.2 |
| November 2025 | Lowood WTP | <0.2 | <0.2 | <0.2 | <0.2 |
| November 2025 | Mt Crosby WTP – Camerons Hill 1 | <0.2 | <0.2 | <0.2 | <0.2 |
| November 2025 | Mt Crosby WTP – Camerons Hill 2 | <0.2 | <0.2 | <0.2 | <0.2 |
October 2025 Raw and Treated Drinking Water Monthly Grab Sampling Results
Overview of results: All results for PFAS are below the old and updated ADWG for PFAS.
Old ADWG for PFAS
| Sample Month | Water Treatment Plant (WTP) | PFOS (ng/L) | PFHxS (ng/L) | PFOA (ng/L) |
|---|---|---|---|---|
| Raw Water Sample | ADWG (PFOS + PFHxS) value: 70 | ADWG value: 560 | ||
| October 2025 | Capalaba WTP | 1.3 | 0.7 | 0.9 |
| October 2025 | Lowood WTP | <0.2 | <0.2 | <0.2 |
| October 2025 | Mt Crosby East Bank WTP | <0.2 | <0.2 | <0.2 |
| October 2025 | Mt Crosby Westbank WTP | <0.2 | <0.2 | <0.2 |
| Treated Water Sample | ADWG (PFOS + PFHxS) value: 70 | ADWG value: 560 | ||
| October 2025 | Capalaba WTP | 0.2 | <0.2 | <0.2 |
| October 2025 | Lowood WTP | <0.2 | <0.2 | <0.2 |
| October 2025 | Mt Crosby WTP – Camerons Hill 1 | <0.2 | <0.2 | <0.2 |
| October 2025 | Mt Crosby WTP – Camerons Hill 2 | <0.2 | <0.2 | <0.2 |
Updated ADWG for PFAS
| Sample Month | Water Treatment Plant (WTP) | PFOS (ng/L) | PFHxS (ng/L) | PFOA (ng/L) | PFBS (ng/L) |
|---|---|---|---|---|---|
| Raw Water Sample | ADWG value: 8 ng/L | ADWG value: 30 ng/L | ADWG value: 200 ng/L | ADWG value: 1000 ng/L | |
| October 2025 | Capalaba WTP | 1.3 | 0.7 | 0.9 | 0.4 |
| October 2025 | Lowood WTP | <0.2 | <0.2 | <0.2 | <0.2 |
| October 2025 | Mt Crosby East Bank WTP | <0.2 | <0.2 | <0.2 | <0.2 |
| October 2025 | Mt Crosby Westbank WTP | <0.2 | <0.2 | <0.2 | <0.2 |
| Treated Water Sample | ADWG value: 8 ng/L | ADWG value: 30 ng/L | ADWG value: 200 ng/L | ADWG value: 1000 ng/L | |
| October 2025 | Capalaba WTP | 0.2 | <0.2 | <0.2 | <0.2 |
| October 2025 | Lowood WTP | <0.2 | <0.2 | <0.2 | 0.2 |
| October 2025 | Mt Crosby WTP – Camerons Hill 1 | <0.2 | <0.2 | <0.2 | <0.2 |
| October 2025 | Mt Crosby WTP – Camerons Hill 2 | <0.2 | <0.2 | <0.2 | <0.2 |
September 2025 Raw and Treated Drinking Water Monthly Grab Sampling Results
Overview of results: All results for PFAS are below the old and updated ADWG for PFAS.
Old ADWG for PFAS
| Sample Month | Water Treatment Plant (WTP) | PFOS (ng/L) | PFHxS (ng/L) | PFOA (ng/L) |
|---|---|---|---|---|
| Raw Water Sample | ADWG (PFOS + PFHxS) value: 70 | ADWG value: 560 | ||
| September | Capalaba WTP | <0.2 | <0.2 | <0.2 |
| September | Lowood WTP | <0.2 | <0.2 | <0.2 |
| September | Mt Crosby East Bank WTP | <0.2 | <0.2 | <0.2 |
| September | Mt Crosby West Bank WTP | <0.2 | <0.2 | <0.2 |
| Treated Water Sample | ADWG (PFOS + PFHxS) value: 70 | ADWG value: 560 | ||
| September | Capalaba WTP | <0.2 | <0.2 | <0.2 |
| September | Lowood WTP | <0.2 | <0.2 | <0.2 |
| September | Mt Crosby WTP (Camerons Hill 1) | <0.2 | <0.2 | <0.2 |
| September | Mt Crosby WTP (Cameron Hill 2) | <0.2 | <0.2 | <0.2 |
Updated ADWG for PFAS
| Sample Month | Water Treatment Plant (WTP) | PFOS (ng/L) | PFHxS (ng/L) | PFOA (ng/L) | PFBS (ng/L) |
|---|---|---|---|---|---|
| Raw Water Sample | ADWG value: 8 ng/L | ADWG value: 30 ng/L | ADWG value: 200 ng/L | ADWG value: 1000 ng/L | |
| September | Capalaba WTP | <0.2 | <0.2 | <0.2 | <0.2 |
| September | Lowood WTP | <0.2 | <0.2 | <0.2 | <0.2 |
| September | Mt Crosby East Bank WTP | <0.2 | <0.2 | <0.2 | <0.2 |
| September | Mt Crosby West Bank WTP | <0.2 | <0.2 | <0.2 | <0.2 |
| Treated Water Sample | ADWG value: 8 ng/L | ADWG value: 30 ng/L | ADWG value: 200 ng/L | ADWG value: 1000 ng/L | |
| September | Capalaba WTP | <0.2 | <0.2 | <0.2 | <0.2 |
| September | Lowood WTP | <0.2 | <0.2 | <0.2 | <0.2 |
| September | Mt Crosby WTP (Camerons Hill 1) | <0.2 | <0.2 | <0.2 | <0.2 |
| September | Mt Crosby WTP (Cameron Hill 2) | <0.2 | <0.2 | <0.2 | <0.2 |
August 2025 Raw and Treated Drinking Water Monthly Grab Sampling Results
Overview of results: All results for PFAS are below the old and updated ADWG for PFAS.
Old ADWG for PFAS
| Sample Month | Water Treatment Plant (WTP) | PFOS (ng/L) | PFHxS (ng/L) | PFOA (ng/L) |
|---|---|---|---|---|
| Raw Water Sample | ADWG (PFOS + PFHxS) value: 70 | ADWG value: 560 | ||
| August | Capalaba WTP | 1.9 | <0.2 | 1.0 |
| August | Lowood WTP | <0.2 | <0.2 | <0.2 |
| August | Mt Crosby East Bank WTP | <0.2 | <0.2 | <0.2 |
| August | Mt Crosby West Bank WTP | <0.2 | <0.2 | <0.2 |
| Treated Water Sample | ADWG (PFOS + PFHxS) value: 70 | ADWG value: 560 | ||
| August | Capalaba WTP | <0.2 | <0.2 | <0.2 |
| August | Lowood WTP | <0.2 | <0.2 | <0.2 |
| August | Mt Crosby WTP (Camerons Hill 1) | <0.2 | <0.2 | <0.2 |
| August | Mt Crosby WTP (Cameron Hill 2) | <0.2 | <0.2 | <0.2 |
Updated ADWG for PFAS
| Sample Month | Water Treatment Plant (WTP) | PFOS (ng/L) | PFHxS (ng/L) | PFOA (ng/L) | PFBS (ng/L) |
|---|---|---|---|---|---|
| Raw Water Sample | ADWG value: 8 ng/L | ADWG value: 30 ng/L | ADWG value: 200 ng/L | ADWG value: 1000 ng/L | |
| August | Capalaba WTP | 1.9 | 0.6 | 1.0 | <0.2 |
| August | Lowood WTP | <0.2 | <0.2 | <0.2 | <0.2 |
| August | Mt Crosby East Bank WTP | <0.2 | <0.2 | <0.2 | <0.2 |
| August | Mt Crosby West Bank WTP | <0.2 | <0.2 | <0.2 | <0.2 |
| Treated Water Sample | ADWG value: 8 ng/L | ADWG value: 30 ng/L | ADWG value: 200 ng/L | ADWG value: 1000 ng/L | |
| August | Capalaba WTP | <0.2 | <0.2 | <0.2 | <0.2 |
| August | Lowood WTP | <0.2 | <0.2 | <0.2 | <0.2 |
| August | Mt Crosby WTP (Camerons Hill 1) | <0.2 | <0.2 | <0.2 | <0.2 |
| August | Mt Crosby WTP (Cameron Hill 2) | <0.2 | <0.2 | <0.2 | <0.2 |
July 2025 Raw and Treated Drinking Water Monthly Grab Sampling Results
Overview of results: All results for PFAS are below the old and updated ADWG for PFAS.
Old ADWG for PFAS
| Sample Month | Water Treatment Plant (WTP) | PFOS (ng/L) | PFHxS (ng/L) | PFOA (ng/L) |
|---|---|---|---|---|
| Raw Water Sample | ADWG (PFOS + PFHxS) value: 70 | ADWG value: 560 | ||
| July | Capalaba WTP | 1.5 | <0.2 | <0.2 |
| July | Lowood WTP | <0.2 | <0.2 | <0.2 |
| July | Mt Crosby East Bank WTP | <0.2 | <0.2 | <0.2 |
| July | Mt Crosby West Bank WTP | <0.2 | <0.2 | <0.2 |
| Treated Water Sample | ADWG (PFOS + PFHxS) value: 70 | ADWG value: 560 | ||
| July | Capalaba WTP | 0.8 | <0.2 | <0.2 |
| July | Lowood WTP | <0.2 | <0.2 | <0.2 |
| July | Mt Crosby WTP (Camerons Hill 1) | <0.2 | <0.2 | <0.2 |
| July | Mt Crosby WTP (Cameron Hill 2) | <0.2 | <0.2 | <0.2 |
Updated ADWG for PFAS
| Sample Month | Water Treatment Plant (WTP) | PFOS (ng/L) | PFHxS (ng/L) | PFOA (ng/L) | PFBS (ng/L) |
|---|---|---|---|---|---|
| Raw Water Sample | ADWG value: 8 ng/L | ADWG value: 30 ng/L | ADWG value: 200 ng/L | ADWG value: 1000 ng/L | |
| July | Capalaba WTP | 1.5 | <0.2 | <0.2 | <0.2 |
| July | Lowood WTP | <0.2 | <0.2 | <0.2 | <0.2 |
| July | Mt Crosby East Bank WTP | <0.2 | <0.2 | <0.2 | <0.2 |
| July | Mt Crosby West Bank WTP | <0.2 | <0.2 | <0.2 | <0.2 |
| Treated Water Sample | ADWG value: 8 ng/L | ADWG value: 30 ng/L | ADWG value: 200 ng/L | ADWG value: 1000 ng/L | |
| July | Capalaba WTP | 0.8 | <0.2 | <0.2 | <0.2 |
| July | Lowood WTP | <0.2 | <0.2 | <0.2 | <0.2 |
| July | Mt Crosby WTP (Camerons Hill 1) | <0.2 | <0.2 | <0.2 | <0.2 |
| July | Mt Crosby WTP (Cameron Hill 2) | <0.2 | <0.2 | <0.2 | <0.2 |
July and August 2025 Raw Water Passive Sampling Results
Overview of results: All results for PFAS are below the old and updated ADWG for PFAS.
Old ADWG for PFAS:
| Sample Month | Water Treatment Plant (WTP) | PFOS (ng/L) | PFHxS (ng/L) | PFOA (ng/L) |
|---|---|---|---|---|
| Raw Water Sample | ADWG (PFOS + PFHxS) value: 70 ng/L | ADWG value: 560 ng/L | ||
| July | Beaudesert WTP | <2.71 | <2.78 | <3.06 |
| July | Boonah-Kalbar WTP | <2.90 | <2.98 | <3.27 |
| July | Canungra WTP | <2.90 | <2.98 | <3.27 |
| July | Capalaba WTP | <2.90 | <2.98 | <3.27 |
| July | Esk WTP | <2.90 | <2.98 | <3.27 |
| July | Ewen Maddock WTP | <2.54 | <2.61 | <2.86 |
| July | Hinze Dam WTP | <2.90 | <2.98 | <3.27 |
| July | Image Flat WTP1 | <2.71 | <2.78 | <3.06 |
| July | Image Flat WTP2 | <2.71 | <2.78 | <3.06 |
| July | Image Flat WTP3 | <2.46 | <2.53 | <2.78 |
| July | Image Flat WTP4 | <2.71 | <2.78 | <3.06 |
| July | Jimna WTP | <2.80 | <2.88 | <3.16 |
| July | Kenilworth WTP | <2.80 | <2.88 | <3.16 |
| August | Kilcoy WTP | <2.90 | <2.98 | <3.27 |
| July | Kirkleagh WTP | <2.90 | <2.98 | <3.27 |
| July | Kooralbyn WTP | <2.71 | <2.78 | <3.06 |
| July | Landers Shute WTP | <2.71 | <2.78 | <3.06 |
| July | Lowood WTP | <2.90 | <2.98 | <3.27 |
| July | Maroon Dam WTP | <2.62 | <2.69 | <2.96 |
| July | Molendinar WTP | <2.90 | <2.98 | <3.27 |
| July | Moogerah Dam WTP | <2.90 | <2.98 | <3.27 |
| July | Mt Crosby East Bank WTP | <2.90 | <2.98 | <3.27 |
| July | Mudgeeraba WTP5 | <2.90 | <2.98 | <3.27 |
| July | Mudgeeraba WTP6 | <2.90 | <2.98 | <3.27 |
| July | Noosa WTP7 | <2.80 | <2.88 | <3.16 |
| July | Noosa WTP8 | <2.80 | <2.88 | <3.16 |
| July | North Pine WTP | <2.80 | <2.88 | <3.16 |
| July | North Stradbroke Island WTP | <2.90 | <2.98 | <3.27 |
| July | Somerset Dam WTP | <2.90 | <2.98 | <3.27 |
1 Poona Dam Raw
2 Wappa Dam Raw
3 Cooloolabin Dam Raw
4 Sth Maroochy Weir Raw
5 Little Nerang Dam Raw
6 Hinze Dam Raw
7 Lake Macdonald Raw
8 Mary River Raw
Updated ADWG for PFAS
| Sample Month | Water Treatment Plant (WTP) | PFOS (ng/L) | PFHxS (ng/L) | PFOA (ng/L) | PFBS (ng/L) |
|---|---|---|---|---|---|
| Raw Water Sample | ADWG value 8 ng/L | ADWG value 30 ng/L | ADWG value: 200 ng/L | ADWG value: 1000 ng/L | |
| July | Beaudesert WTP | <2.71 | <2.78 | <3.06 | <2.65 |
| July | Boonah-Kalbar WTP | <2.90 | <2.98 | <3.27 | <2.84 |
| July | Canungra WTP | <2.90 | <2.98 | <3.27 | <2.84 |
| July | Capalaba WTP | <2.90 | <2.98 | <3.27 | <2.84 |
| July | Esk WTP | <2.90 | <2.98 | <3.27 | <2.84 |
| July | Ewen Maddock WTP | <2.54 | <2.61 | <2.86 | <2.49 |
| July | Hinze Dam WTP | <2.90 | <2.98 | <3.27 | <2.84 |
| July | Image Flat WTP1 | <2.71 | <2.78 | <3.06 | <2.65 |
| July | Image Flat WTP2 | <2.71 | <2.78 | <3.06 | <2.65 |
| July | Image Flat WTP3 | <2.46 | <2.53 | <2.78 | <2.41 |
| July | Image Flat WTP4 | <2.71 | <2.78 | <3.06 | <2.65 |
| July | Jimna WTP | <2.80 | <2.88 | <3.16 | <2.74 |
| July | Kenilworth WTP | <2.80 | <2.88 | <3.16 | <2.74 |
| August | Kilcoy WTP | <2.90 | <2.98 | <3.27 | <2.84 |
| July | Kirkleagh WTP | <2.90 | <2.98 | <3.27 | <2.84 |
| July | Kooralbyn WTP | <2.71 | <2.78 | <3.06 | <2.65 |
| July | Landers Shute WTP | <2.71 | <2.78 | <3.06 | <2.65 |
| July | Lowood WTP | <2.90 | <2.98 | <3.27 | <2.84 |
| July | Maroon Dam WTP | <2.62 | <2.69 | <2.96 | <2.57 |
| July | Molendinar WTP | <2.90 | <2.98 | <3.27 | <2.84 |
| July | Moogerah Dam WTP | <2.90 | <2.98 | <3.27 | <2.84 |
| July | Mt Crosby East Bank WTP | <2.90 | <2.98 | <3.27 | <2.84 |
| July | Mudgeeraba WTP5 | <2.90 | <2.98 | <3.27 | <2.84 |
| July | Mudgeeraba WTP6 | <2.90 | <2.98 | <3.27 | <2.84 |
| July | Noosa WTP7 | <2.80 | <2.88 | <3.16 | <2.74 |
| July | Noosa WTP8 | <2.80 | <2.88 | <3.16 | <2.74 |
| July | North Pine WTP | <2.80 | <2.88 | <3.16 | <2.74 |
| July | North Stradbroke Island WTP | <2.90 | <2.98 | <3.27 | <2.84 |
| July | Somerset Dam WTP | <2.90 | <2.98 | <3.27 | <2.84 |
1 Poona Dam Raw
2 Wappa Dam Raw
3 Cooloolabin Dam Raw
4 Sth Maroochy Weir Raw
5 Little Nerang Dam Raw
6 Hinze Dam Raw
7 Lake Macdonald Raw
8 Mary River Raw
June 2025 Raw and Treated Drinking Water Monthly Grab Sampling Results
Overview of results: All results for PFAS are below the old and updated ADWG for PFAS.
Old ADWG for PFAS
| Sample Month | Water Treatment Plant (WTP) | PFOS (ng/L) | PFHxS (ng/L) | PFOA (ng/L) |
|---|---|---|---|---|
| Raw Water Sample | ADWG (PFOS + PFHxS) value: 70 | ADWG value: 560 | ||
| June | Capalaba WTP | 1.3 | <0.2 | 1.0 |
| June | Lowood WTP | <0.2 | <0.2 | <0.2 |
| June | Mt Crosby East Bank WTP | 0.2 | <0.2 | 0.2 |
| June | Mt Crosby West Bank WTP | <0.2 | <0.2 | <0.2 |
| Treated Water Sample | ADWG (PFOS + PFHxS) value: 70 | ADWG value: 560 | ||
| June | Capalaba WTP | 1.1 | <0.2 | 0.4 |
| June | Lowood WTP | <0.2 | <0.2 | <0.2 |
| June | Mt Crosby WTP (Camerons Hill 1) | <0.2 | <0.2 | <0.2 |
| June | Mt Crosby WTP (Cameron Hill 2) | <0.2 | <0.2 | <0.2 |
Updated ADWG for PFAS
| Sample Month | Water Treatment Plant (WTP) | PFOS (ng/L) | PFHxS (ng/L) | PFOA (ng/L) | PFBS (ng/L) |
|---|---|---|---|---|---|
| Raw Water Sample | ADWG value: 8 ng/L | ADWG value: 30 ng/L | ADWG value: 200 ng/L | ADWG value: 1000 ng/L | |
| June | Capalaba WTP | 1.3 | <0.2 | 1.0 | <0.2 |
| June | Lowood WTP | <0.2 | <0.2 | <0.2 | <0.2 |
| June | Mt Crosby East Bank WTP | 0.2 | <0.2 | 0.2 | <0.2 |
| June | Mt Crosby West Bank WTP | <0.2 | <0.2 | <0.2 | <0.2 |
| Treated Water Sample | ADWG value: 8 ng/L | ADWG value: 30 ng/L | ADWG value: 200 ng/L | ADWG value: 1000 ng/L | |
| June | Capalaba WTP | 1.1 | <0.2 | 0.4 | <0.2 |
| June | Lowood WTP | <0.2 | <0.2 | <0.2 | <0.2 |
| June | Mt Crosby WTP (Camerons Hill 1) | <0.2 | <0.2 | <0.2 | <0.2 |
| June | Mt Crosby WTP (Cameron Hill 2) | <0.2 | <0.2 | <0.2 | <0.2 |
May 2025 Raw and Treated Drinking Water Monthly Grab Sampling Results
Overview of results: All results for PFAS are below the old and updated ADWG for PFAS.
Old ADWG for PFAS
| Sample Month | Water Treatment Plant (WTP) | PFOS (ng/L) | PFHxS (ng/L) | PFOA (ng/L) |
|---|---|---|---|---|
| Raw Water Sample | ADWG (PFOS + PFHxS) value: 70 | ADWG value: 560 | ||
| May | Capalaba WTP | 3.3 | <0.2 | <0.2 |
| May | Lowood WTP | <0.2 | <0.2 | <0.2 |
| May | Mt Crosby East Bank WTP | <0.2 | <0.2 | <0.2 |
| May | Mt Crosby West Bank WTP | <0.2 | <0.2 | <0.2 |
| Treated Water Sample | ADWG (PFOS + PFHxS) value: 70 | ADWG value: 560 | ||
| May | Capalaba WTP | 3.6 | <0.2 | <0.2 |
| May | Lowood WTP | <0.2 | <0.2 | <0.2 |
| May | Mt Crosby WTP (Camerons Hill 1) | <0.2 | <0.2 | <0.2 |
| May | Mt Crosby WTP (Cameron Hill 2) | <0.2 | <0.2 | <0.2 |
Updated ADWG for PFAS
| Sample Month | Water Treatment Plant (WTP) | PFOS (ng/L) | PFHxS (ng/L) | PFOA (ng/L) | PFBS (ng/L) |
|---|---|---|---|---|---|
| Raw Water Sample | ADWG value: 8 ng/L | ADWG value: 30 ng/L | ADWG value: 200 ng/L | ADWG value: 1000 ng/L | |
| May | Capalaba WTP | 3.3 | <0.2 | <0.2 | <0.2 |
| May | Lowood WTP | <0.2 | <0.2 | <0.2 | <0.2 |
| May | Mt Crosby East Bank WTP | <0.2 | <0.2 | <0.2 | <0.2 |
| May | Mt Crosby West Bank WTP | <0.2 | <0.2 | <0.2 | <0.2 |
| Treated Water Sample | ADWG value: 8 ng/L | ADWG value: 30 ng/L | ADWG value: 200 ng/L | ADWG value: 1000 ng/L | |
| May | Capalaba WTP | 3.6 | <0.2 | <0.2 | <0.2 |
| May | Lowood WTP | <0.2 | <0.2 | <0.2 | <0.2 |
| May | Mt Crosby WTP (Camerons Hill 1) | <0.2 | <0.2 | <0.2 | <0.2 |
| May | Mt Crosby WTP (Cameron Hill 2) | <0.2 | <0.2 | <0.2 | <0.2 |
April 2025 Raw and Treated Drinking Water Monthly Grab Sampling Results
Overview of results: All results for PFAS are below the old and updated ADWG for PFAS.
Old ADWG for PFAS
| Sample Month | Water Treatment Plant (WTP) | PFOS (ng/L) | PFHxS (ng/L) | PFOA (ng/L) |
|---|---|---|---|---|
| Raw Water Sample | ADWG (PFOS + PFHxS) value: 70 | ADWG value: 560 | ||
| April | Capalaba WTP | <0.2 | <0.2 | <0.2 |
| April | Lowood WTP | <0.2 | <0.2 | <0.2 |
| April | Mt Crosby East Bank WTP | <0.2 | <0.2 | <0.2 |
| April | Mt Crosby West Bank WTP | <0.2 | <0.2 | <0.2 |
| Treated Water Sample | ADWG (PFOS + PFHxS) value: 70 | ADWG value: 560 | ||
| April | Capalaba WTP | <0.2 | <0.2 | <0.2 |
| April | Lowood WTP | <0.2 | <0.2 | <0.2 |
| April | Mt Crosby WTP (Camerons Hill 1) | <0.2 | <0.2 | <0.2 |
| April | Mt Crosby WTP (Cameron Hill 2) | <0.2 | <0.2 | <0.2 |
Updated ADWG for PFAS
| Sample Month | Water Treatment Plant (WTP) | PFOS (ng/L) | PFHxS (ng/L) | PFOA (ng/L) | PFBS (ng/L) |
|---|---|---|---|---|---|
| Raw Water Sample | ADWG value: 8 ng/L | ADWG value: 30 ng/L | ADWG value: 200 ng/L | ADWG value: 1000 ng/L | |
| April | Capalaba WTP | <0.2 | <0.2 | <0.2 | <0.2 |
| April | Lowood WTP | <0.2 | <0.2 | <0.2 | <0.2 |
| April | Mt Crosby East Bank WTP | <0.2 | <0.2 | <0.2 | <0.2 |
| April | Mt Crosby West Bank WTP | <0.2 | <0.2 | <0.2 | <0.2 |
| Treated Water Sample | ADWG value: 8 ng/L | ADWG value: 30 ng/L | ADWG value: 200 ng/L | ADWG value: 1000 ng/L | |
| April | Capalaba WTP | <0.2 | <0.2 | <0.2 | <0.2 |
| April | Lowood WTP | <0.2 | <0.2 | <0.2 | <0.2 |
| April | Mt Crosby WTP (Camerons Hill 1) | <0.2 | <0.2 | <0.2 | <0.2 |
| April | Mt Crosby WTP (Cameron Hill 2) | <0.2 | <0.2 | <0.2 | <0.2 |
March 2025 Raw and Treated Drinking Water Monthly Grab Sampling Results
Overview of results: All results for PFAS are below the old and updated ADWG for PFAS.
Old ADWG for PFAS
| Sample Month | Water Treatment Plant (WTP) | PFOS (ng/L) | PFHxS (ng/L) | PFOA (ng/L) |
|---|---|---|---|---|
| Raw Water Sample | ADWG (PFOS + PFHxS) value: 70 | ADWG value: 560 | ||
| March | Capalaba WTP | <0.2 | 0.6 | 0.7 |
| March | Lowood WTP | <0.2 | <0.2 | <0.2 |
| March | Mt Crosby East Bank WTP | <0.2 | <0.2 | <0.2 |
| March | Mt Crosby West Bank WTP | <0.2 | <0.2 | <0.2 |
| Treated Water Sample | ADWG (PFOS + PFHxS) value: 70 | ADWG value: 560 | ||
| March | Capalaba WTP | <0.2 | 0.4 | 0.3 |
| March | Lowood WTP | <0.2 | <0.2 | <0.2 |
| March | Mt Crosby WTP (Camerons Hill 1) | <0.2 | <0.2 | <0.2 |
| March | Mt Crosby WTP (Cameron Hill 2) | <0.2 | <0.2 | <0.2 |
Updated ADWG for PFAS
| Sample Month | Water Treatment Plant (WTP) | PFOS (ng/L) | PFHxS (ng/L) | PFOA (ng/L) | PFBS (ng/L) |
|---|---|---|---|---|---|
| Raw Water Sample | ADWG value: 8 ng/L | ADWG value: 30 ng/L | ADWG value: 200 ng/L | ADWG value: 1000 ng/L | |
| March | Capalaba WTP | <0.2 | 0.6 | 0.7 | <0.2 |
| March | Lowood WTP | <0.2 | <0.2 | <0.2 | <0.2 |
| March | Mt Crosby East Bank WTP | <0.2 | <0.2 | <0.2 | <0.2 |
| March | Mt Crosby West Bank WTP | <0.2 | <0.2 | <0.2 | <0.2 |
| Treated Water Sample | ADWG value: 8 ng/L | ADWG value: 30 ng/L | ADWG value: 200 ng/L | ADWG value: 1000 ng/L | |
| March | Capalaba WTP | <0.2 | 0.4 | 0.3 | <0.2 |
| March | Lowood WTP | <0.2 | <0.2 | <0.2 | <0.2 |
| March | Mt Crosby WTP (Camerons Hill 1) | <0.2 | <0.2 | <0.2 | <0.2 |
| March | Mt Crosby WTP (Cameron Hill 2) | <0.2 | <0.2 | <0.2 | <0.2 |
February and April 2025 Raw Water Grab Sampling Results
Passive samplers cannot be used at some water treatment plants due to location restraints. In these instances, a grab sample is taken.
Overview of results: All results for PFAS are below the old and updated ADWG for PFAS.
Old ADWG for PFAS
| Sample Month | Water Treatment Plant (WTP) | PFOS (ng/L) | PFHxS (ng/L) | (PFOA (ng/L) |
|---|---|---|---|---|
| Raw Water Sample | ADWG (PFOS + PFHxS) value: 70 ng/L | ADWG value: 560 ng/L | ||
| April | North Stradbroke Island WTP | <0.2 | <0.2 | <0.2 |
| April | Point Lookout WTP | <0.2 | <0.2 | <0.2 |
| April | Amity Point WTP | <0.2 | <0.2 | <0.2 |
| April | Dunwich WTP | <0.2 | <0.2 | <0.2 |
| April | Linville WTP | <0.2 | <0.2 | <0.2 |
| February | Dayboro WTP* | <0.2 | <0.2 | <0.2 |
| February | Rathdowney WTP | <0.2 | <0.2 | <0.2 |
*Source water sample
Updated ADWG for PFAS
| Sample Month | Water Treatment Plant (WTP) | PFOS (ng/L) | PFHxS (ng/L) | (PFOA (ng/L) | PFBS (ng/L) |
|---|---|---|---|---|---|
| Raw Water Sample | ADWG value: 8 ng/L | ADWG value 30 ng/L | ADWG value: 200 ng/L | ADWG value: 1000 ng/L | |
| April | North Stradbroke Island WTP | <0.2 | <0.2 | <0.2 | <0.2 |
| April | Point Lookout WTP | <0.2 | <0.2 | <0.2 | <0.2 |
| April | Amity Point WTP | <0.2 | <0.2 | <0.2 | <0.2 |
| April | Dunwich WTP | <0.2 | <0.2 | <0.2 | <0.2 |
| April | Linville WTP | <0.2 | <0.2 | <0.2 | <0.2 |
| February | Dayboro WTP* | <0.2 | <0.2 | <0.2 | <0.2 |
| February | Rathdowney WTP | <0.2 | <0.2 | <0.2 | <0.2 |
*Source water sample
January and February 2025 Raw Water Passive Sampling Results
Overview of results: All results for PFAS are below the old and updated ADWG for PFAS.
Old ADWG for PFAS:
| Sample Month | Water Treatment Plant (WTP) | PFOS (ng/L) | PFHxS (ng/L) | PFOA (ng/L) |
|---|---|---|---|---|
| Raw Water Sample | ADWG (PFOS + PFHxS) value: 70 ng/L | ADWG value: 560 ng/L | ||
| February | Beaudesert WTP | <2.90 | <2.98 | <3.27 |
| February | Boonah-Kalbar WTP | <2.90 | <2.98 | <3.27 |
| February | Canungra WTP | <2.90 | <2.98 | <3.27 |
| February | Capalaba WTP | 3.22 | <2.61 | <2.86 |
| February | Esk WTP | <2.90 | <2.98 | <3.27 |
| March | Ewen Maddock WTP | <2.80 | <2.88 | <3.16 |
| February | Hinze Dam WTP | <2.90 | <2.98 | <3.27 |
| February | Image Flat WTP1 | <2.90 | <2.98 | <3.27 |
| February | Image Flat WTP2 | <2.90 | <2.98 | <3.27 |
| February | Image Flat WTP3 | <2.90 | <2.98 | <3.27 |
| February | Image Flat WTP4 | <2.90 | <2.98 | <3.27 |
| February | Jimna WTP | <3.01 | <3.09 | <3.40 |
| February | Kenilworth WTP | <3.01 | <3.09 | <3.40 |
| February | Kilcoy WTP | <2.54 | <2.61 | <2.86 |
| February | Kirkleagh WTP | <2.54 | <2.61 | <2.86 |
| February | Kooralbyn WTP | <2.90 | <2.98 | <3.27 |
| February | Landers Shute WTP | <2.90 | <2.98 | <3.27 |
| February | Lowood WTP | <2.90 | <2.98 | <3.27 |
| March | Maroon Dam WTP | <2.80 | <2.88 | <3.16 |
| February | Molendinar WTP | <2.90 | <2.98 | <3.27 |
| February | Moogerah Dam WTP | <2.90 | <2.98 | <3.27 |
| February | Mt Crosby East Bank WTP | <2.26 | <2.32 | <2.55 |
| February | Mt Crosby West Bank WTP | <2.26 | <2.32 | <2.55 |
| February | Mudgeeraba WTP5 | <2.90 | <2.98 | <3.27 |
| February | Mudgeeraba WTP6 | <2.90 | <2.98 | <3.27 |
| February | Noosa WTP7 | <2.39 | <2.46 | <2.70 |
| February | Noosa WTP8 | <2.32 | <2.39 | <2.62 |
| February | North Pine WTP | <2.90 | <2.98 | <3.27 |
| February | Somerset Dam WTP | <2.54 | <2.61 | <2.86 |
1 Poona Dam Raw
2 Wappa Dam Raw
3 Cooloolabin Dam Raw
4 Sth Maroochy Weir Raw
5 Little Nerang Dam Raw
6 Hinze Dam Raw
7 Lake Macdonald Raw
8 Mary River Raw
Updated ADWG for PFAS
| Sample Month | Water Treatment Plant (WTP) | PFOS (ng/L) | PFHxS (ng/L) | PFOA (ng/L) | PFBS (ng/L) |
|---|---|---|---|---|---|
| Raw Water Sample | ADWG value 8 ng/L | ADWG value 30 ng/L | ADWG value: 200 ng/L | ADWG value: 1000 ng/L | |
| February | Beaudesert WTP | <2.90 | <2.98 | <3.27 | <2.84 |
| February | Boonah-Kalbar WTP | <2.90 | <2.98 | <3.27 | <2.84 |
| February | Canungra WTP | <2.90 | <2.98 | <3.27 | <2.84 |
| February | Capalaba WTP | 3.22 | <2.61 | <2.86 | <2.49 |
| February | Esk WTP | <2.90 | <2.98 | <3.27 | <2.84 |
| March | Ewen Maddock WTP | <2.80 | <2.88 | <3.16 | <2.74 |
| February | Hinze Dam WTP | <2.90 | <2.98 | <3.27 | <2.84 |
| February | Image Flat WTP1 | <2.90 | <2.98 | <3.27 | <2.84 |
| February | Image Flat WTP2 | <2.90 | <2.98 | <3.27 | <2.84 |
| February | Image Flat WTP3 | <2.90 | <2.98 | <3.27 | <2.84 |
| February | Image Flat WTP4 | <2.90 | <2.98 | <3.27 | <2.84 |
| February | Jimna WTP | <3.01 | <3.09 | <3.40 | <2.95 |
| February | Kenilworth WTP | <3.01 | <3.09 | <3.40 | <2.95 |
| February | Kilcoy WTP | <2.54 | <2.61 | <2.86 | <2.49 |
| February | Kirkleagh WTP | <2.54 | <2.61 | <2.86 | <2.49 |
| February | Kooralbyn WTP | <2.90 | <2.98 | <3.27 | <2.84 |
| February | Landers Shute WTP | <2.90 | <2.98 | <3.27 | <2.84 |
| February | Lowood WTP | <2.90 | <2.98 | <3.27 | <2.84 |
| March | Maroon Dam WTP | <2.80 | <2.88 | <3.16 | <2.74 |
| February | Molendinar WTP | <2.90 | <2.98 | <3.27 | <2.84 |
| February | Moogerah Dam WTP | <2.90 | <2.98 | <3.27 | <2.84 |
| February | Mt Crosby East Bank WTP | <2.26 | <2.32 | <2.55 | <2.21 |
| February | Mt Crosby West Bank WTP | <2.26 | <2.32 | <2.55 | <2.21 |
| February | Mudgeeraba WTP5 | <2.90 | <2.98 | <3.27 | <2.84 |
| February | Mudgeeraba WTP6 | <2.90 | <2.98 | <3.27 | <2.84 |
| February | Noosa WTP7 | <2.39 | <2.46 | <2.70 | <2.34 |
| February | Noosa WTP8 | <2.32 | <2.39 | <2.62 | <2.27 |
| February | North Pine WTP | <2.90 | <2.98 | <3.27 | <2.84 |
| February | Somerset Dam WTP | <2.54 | <2.61 | <2.86 | <2.49 |
1 Poona Dam Raw
2 Wappa Dam Raw
3 Cooloolabin Dam Raw
4 Sth Maroochy Weir Raw
5 Little Nerang Dam Raw
6 Hinze Dam Raw
7 Lake Macdonald Raw
8 Mary River Raw
September 2024 Raw Water Passive Sampling Results
Note: All results for PFAS are below the old and updated ADWG for PFAS.
Old ADWG for PFAS
| Sample Month | Water Treatment Plant (WTP) | PFOS (ng/L) | PFHxS (ng/L) | PFOA (ng/L) |
|---|---|---|---|---|
| Raw Water Sample | ADWG (PFOS + PFHxS) value: 70 ng/L | ADWG value: 560 ng/L | ||
| Sep-24 | Amity Point WTP | <0.2 | <0.2 | <0.2 |
| Sep-24 | Beaudesert WTP | <0.2 | <0.2 | <0.2 |
| Sep-24 | Boonah-Kalbar WTP | <0.2 | <0.2 | <0.2 |
| Sep-24 | Canungra WTP | <0.2 | <0.2 | <0.2 |
| Sep-24 | Capalaba WTP | 2.6 | 1.5 | 0.3 |
| Sep-24 | Dayboro WTP | <0.2 | <0.2 | <0.2 |
| Sep-24 | Dunwich WTP | <0.2 | <0.2 | <0.2 |
| Sep-24 | Esk WTP | <0.2 | <0.2 | <0.2 |
| Sep-24 | Ewen Maddock WTP | 0.5 | <0.2 | <0.2 |
| Sep-24 | Hinze Dam WTP | <0.2 | <0.2 | <0.2 |
| Sep-24 | Image Flat WTP | <0.2 | <0.2 | <0.2 |
| Sep-24 | Jimna WTP | <0.2 | <0.2 | <0.2 |
| Sep-24 | Kenilworth WTP | <0.2 | <0.2 | <0.2 |
| Sep-24 | Kilcoy WTP | <0.2 | <0.2 | <0.2 |
| Sep-24 | Kirkleagh WTP | <0.2 | <0.2 | <0.2 |
| Sep-24 | Kooralbyn WTP | <0.2 | <0.2 | <0.2 |
| Sep-24 | Landers Shute WTP | <0.2 | <0.2 | <0.2 |
| Sep-24 | Linville WTP | <0.2 | <0.2 | <0.2 |
| Sep-24 | Lowood WTP | <0.2 | <0.2 | <0.2 |
| Sep-24 | Maroon Dam WTP | <0.2 | <0.2 | <0.2 |
| Sep-24 | Molendinar WTP | <0.2 | <0.2 | <0.2 |
| Sep-24 | Moogerah Dam WTP | <0.2 | <0.2 | <0.2 |
| Sep-24 | Mt Crosby East Bank WTP | <0.2 | <0.2 | <0.2 |
| Sep-24 | Mt Crosby West Bank WTP | <0.2 | <0.2 | <0.2 |
| Sep-24 | Mudgeeraba WTP1 | <0.2 | <0.2 | <0.2 |
| Sep-24 | Mudgeeraba WTP2 | <0.2 | <0.2 | <0.2 |
| Sep-24 | Noosa WTP3 | <0.2 | <0.2 | <0.2 |
| Sep-24 | Noosa WTP4 | <0.2 | <0.2 | <0.2 |
| Sep-24 | North Pine WTP | <0.2 | <0.2 | <0.2 |
| Sep-24 | North Stradbroke Island WTP | <0.2 | <0.2 | <0.2 |
| Sep-24 | Point Lookout WTP | <0.2 | <0.2 | <0.2 |
| Sep-24 | Rathdowney WTP | <0.2 | <0.2 | <0.2 |
| Sep-24 | Somerset Dam WTP | <0.2 | <0.2 | <0.2 |
Updated ADWG for PFAS
| Sample Month | Water Treatment Plant (WTP) | PFOS (ng/L) | PFHxS (ng/L) | PFOA (ng/L) | PFBS (ng/L) |
|---|---|---|---|---|---|
| Raw Water Sample | ADWG value: 8 ng/L | ADWG value: 30 ng/L | ADWG value: 200 ng/L | ADWG value: 1000 ng/L | |
| Sep-24 | Amity Point WTP | <0.2 | <0.2 | <0.2 | <0.2 |
| Sep-24 | Beaudesert WTP | <0.2 | <0.2 | <0.2 | <0.2 |
| Sep-24 | Boonah-Kalbar WTP | <0.2 | <0.2 | <0.2 | <0.2 |
| Sep-24 | Canungra WTP | <0.2 | <0.2 | <0.2 | <0.2 |
| Sep-24 | Capalaba WTP | 2.6 | 1.5 | 0.3 | 0.8 |
| Sep-24 | Dayboro WTP | <0.2 | <0.2 | <0.2 | <0.2 |
| Sep-24 | Dunwich WTP | <0.2 | <0.2 | <0.2 | <0.2 |
| Sep-24 | Esk WTP | <0.2 | <0.2 | <0.2 | <0.2 |
| Sep-24 | Ewen Maddock WTP | 0.5 | <0.2 | <0.2 | <0.2 |
| Sep-24 | Hinze Dam WTP | <0.2 | <0.2 | <0.2 | <0.2 |
| Sep-24 | Image Flat WTP | <0.2 | <0.2 | <0.2 | <0.2 |
| Sep-24 | Jimna WTP | <0.2 | <0.2 | <0.2 | <0.2 |
| Sep-24 | Kenilworth WTP | <0.2 | <0.2 | <0.2 | <0.2 |
| Sep-24 | Kilcoy WTP | <0.2 | <0.2 | <0.2 | <0.2 |
| Sep-24 | Kirkleagh WTP | <0.2 | <0.2 | <0.2 | <0.2 |
| Sep-24 | Kooralbyn WTP | <0.2 | <0.2 | <0.2 | <0.2 |
| Sep-24 | Landers Shute WTP | <0.2 | <0.2 | <0.2 | <0.2 |
| Sep-24 | Linville WTP | <0.2 | <0.2 | <0.2 | <0.2 |
| Sep-24 | Lowood WTP | <0.2 | <0.2 | <0.2 | <0.2 |
| Sep-24 | Maroon Dam WTP | <0.2 | <0.2 | <0.2 | <0.2 |
| Sep-24 | Molendinar WTP | <0.2 | <0.2 | <0.2 | <0.2 |
| Sep-24 | Moogerah Dam WTP | <0.2 | <0.2 | <0.2 | <0.2 |
| Sep-24 | Mt Crosby East Bank WTP | <0.2 | <0.2 | <0.2 | <0.2 |
| Sep-24 | Mt Crosby West Bank WTP | <0.2 | <0.2 | <0.2 | <0.2 |
| Sep-24 | Mudgeeraba WTP1 | <0.2 | <0.2 | <0.2 | <0.2 |
| Sep-24 | Mudgeeraba WTP2 | <0.2 | <0.2 | <0.2 | <0.2 |
| Sep-24 | Noosa WTP3 | <0.2 | <0.2 | <0.2 | <0.2 |
| Sep-24 | Noosa WTP4 | <0.2 | <0.2 | <0.2 | <0.2 |
| Sep-24 | North Pine WTP | <0.2 | <0.2 | <0.2 | <0.2 |
| Sep-24 | North Stradbroke Island WTP | <0.2 | <0.2 | <0.2 | <0.2 |
| Sep-24 | Point Lookout WTP | <0.2 | <0.2 | <0.2 | <0.2 |
| Sep-24 | Rathdowney WTP | <0.2 | <0.2 | <0.2 | <0.2 |
| Sep-24 | Somerset Dam WTP | <0.2 | <0.2 | <0.2 | <0.2 |
Passive sampling technology
We have many techniques to test for micropollutants like PFAS, including the use of very sensitive passive sampling technology which is used at many of our sites to monitor for PFAS.
We partner with researchers from The University of Queensland for the supply of these passive samplers to test for PFAS and other micropollutants across South East Queensland’s raw water supplies.
Developed by the Queensland Alliance for Environmental Health Sciences, the Microporous Polyethylene Tube (MPT) is deployed at water treatment plant (WTP) offtakes for approximately one month and is designed to soak up any PFAS substances in the water.
Passive sampling technology is beneficial as it is highly sensitive to micropollutants such as PFAS and it provides readings over a period of time, supporting a better understanding of the presence of PFAS.
Watch the video to see how the Queensland Alliance for Environmental Health Sciences developed technology to test for PFAS in our catchments.
For more information
- For public health enquiries, call Queensland Health on 13HEALTH (13 43 25 84). You can also find more information here.
- For more information on The Australia Drinking Water Guidelines, visit The National Health and Medical Research Council.
- For more information on PFAS, visit the Water Services Association of Australia.
- Read our Frequently Asked Questions below.
Frequently asked questions
No FAQs match your query
PFAS (per- and polyfluoroalkyl substances) are a group of human-made chemicals that have been widely used in industrial and consumer products since the mid-1900s.
Due to the unique physical and chemical properties of PFAS to resist heat, stains, grease and water, they have been used in items including firefighting foams, textiles and leather products, food packaging, non-stick cookware, cosmetics, sunscreens, denture cleaner and medical devices.
Because PFAS break down slowly, they are sometimes referred to as forever chemicals.
Providing clean, safe drinking water is Seqwater’s number one priority and our water continues to meet the standards set by the Australian Drinking Water Guidelines (ADWG).
The Australian Drinking Water Guidelines (ADWG) are determined by the National Health and Medical Research Council (NHMRC).
No. Unlike other chemicals such as chlorine and fluoride which are added to drinking water as part of our multi-step approach to water treatment, Seqwater does not add PFAS to the region’s drinking water supplies.
However, PFAS can be present in our water due to external sources. The NHMRC note that exposure to PFAS can occur through many pathways including consumer products, food packaging, air and dust, and drinking water.
Although, exposure to PFOS and PFOA from drinking water has been previously estimated to be approximately 2-3% of total exposure to PFAS1 in areas with low levels of contamination.
The importation of PFAS in Australia has been reduced since 2002 and the the Australian Government has prohibited import, manufacture and export of PFOA, PFOS and PFHxS from 1 July 2025.
Source: Water Services Association Australia (WSAA) fact sheet.
1 Thompson J, Eaglesham G, Mueller J (2011). Concentrations of PFOS, PFOA and other perfluorinated alkyl acids in Australian drinking water. Chemosphere 83; 1320-1325.
In accordance with the Australian Drinking Water Guidelines (ADWG), Seqwater tests for a wide range of contaminants in our raw and treated drinking water, plus off-grid supplies.
Seqwater also regularly monitors for PFAS in the region’s drinking water supplies, including:
- Twice-yearly region-wide raw water monitoring mostly via highly sensitive passive sampling technology. Testing is conducted in January and February (summer) and July and August (winter). We aim to publish results on our website within three months after testing is complete. This is determined by the collection and validation of independent laboratories.
- Monthly raw and treated drinking water monitoring via grab sampling at the Mount Crosby, Capalaba and Lowood Water Treatment Plants.
Additional testing may also occur to support further catchment analysis and risk assessments, in addition to investigations conducted by the Queensland Government and other agencies.
The number of high-risk facilities such as fire-fighting training grounds, large airfields and heavy industrial facilities (particularly those with oil and chemical management and processing facilities) in Seqwater’s catchments are very low or not present. This is based on catchment understanding including sanitary surveys (which include both microbial and chemical risk identification elements).
Based on the catchment risk assessment, and that results for PFAS monitoring across raw, treated and off-grid water supplies in 2018 and in additional testing over subsequent years were below the ADWG, Seqwater had previously adopted an intermittent approach to testing for PFAS.
We understand the public health interest in PFAS and out of an abundance of caution, we’ve enhanced the frequency of our monitoring for PFAS and are regularly making results available on our website so that the community can feel informed about what’s in their drinking water.
Seqwater employs multiple techniques to test for micropollutants such as PFAS, including the use of sensitive passive sampling technology which is mostly used as part of our twice-yearly region-wide raw water monitoring campaigns.
The University of Queensland supplies Seqwater with passive samplers to test for PFAS and other micropollutants across South East Queensland’s raw water supplies.
Developed by the Queensland Alliance for Environmental Health Services, the Microporous Polyethylene Tube (MPT) is deployed at each water treatment plant (WTP) offtake for approximately one month and is designed to soak up any PFAS detections in the raw water.
Passive sampling technology is beneficial as it is highly sensitive to micropollutants like PFAS and it provides readings over a period of time, supporting a better understanding of the presence of PFAS.
Seqwater also adopts grab sampling as part of its monthly testing for PFAS in the raw and treated drinking water at the Mount Crosby, Capalaba and Lowood Water Treatment Plants. Grab sampling is also used when deploying passive samplers is not feasible (i.e., due to location restraints).
Seqwater does not add or remove PFAS from the region’s drinking water.
Because PFAS chemicals are difficult to breakdown and have been used in a wide variety of applications over time, they are present in many environments. As such, weather events (drought, rain, flood etc) or climatic differences (i.e., the wet season) may impact inflows into the catchment and PFAS levels.
Results for PFAS can also vary due to sampling and analytical differences.
Seqwater adopts both grab and passive sampling techniques to test for PFAS and slight variations can arise due to the differences in sampling.
Given PFAS is used across a wide variety of applications, including make-up and many consumer products, , sample contamination during testing can also occur. Seqwater has recently enhanced its controls to mitigate sample contamination when monitoring for PFAS.
Due to the highly sensitive nature of testing, results at very low levels can also be variable due to the testing methods and specialist equipment used in the laboratory.
Seqwater is committed to delivering clean, safe drinking water.
If PFAS are detected at high levels in raw or treated drinking water, Seqwater would adopt a risk-informed approach to the management of drinking water quality.
Several factors influence this approach and can include, but are not limited to:
- The types of PFAS detected and their measured concentrations
- The location of sampling.
Any actions by Seqwater would be undertaken in consultation with the Queensland Government’s Water Supply Regulator and Queensland Health and can include, but are not limited to:
- Follow up testing
- Utilising alternate water supplies if available and optimisation of the SEQ Water Grid where possible
- The provision of information to the general public.
PFAS are difficult to remove from water using conventional water treatment methods such as coagulation and filtration. Proven technologies that remove or reduce PFAS levels in water include:
- Activated carbon
- Anion exchange
- Reverse osmosis or nanofiltration.
Some of Seqwater’s water treatment plants have activated carbon treatment processes. These assets were not specifically designed to remove PFAS but may assist if elevated levels are present. The Gold Coast Desalination Plant also utilises reverse osmosis which is effective at removing PFAS.
Seqwater’s number one priority is to deliver clean, safe and valued drinking water to South East Queenslanders and is committed to investigating current and emerging technologies to ensure a safe, sustainable and reliable supply of drinking water to our community. We ensure water treatment options are adopted based on risk level so that our drinking water continues to meet the standards set by the Australian Drinking Water Guidelines, while being delivered in a cost-effective way.
The properties of PFAS that make them useful for fire retardants or resistant to stains mean they are not amenable to removal through conventional water treatment processes including coagulation, flocculation, settling and filtration or oxidation with chlorine or ozone.
Removing PFAS from water involves separating it through absorption (activated carbon or ion exchange) or by size exclusion through high pressure membranes (reverse osmosis or nanofiltration).
The ADWG is periodically reviewed by the NHMRC in line with the latest scientific evidence.
The ADWG for PFAS was updated by the NHMRC in June 2025 in line with the latest scientific data to maintain clean, safe drinking water.
The new guidelines include lower levels for three types of PFAS (PFOS, PFOA and PFHxS) and the introduction of a limit for PFBS.
The ADWG specifies a limit for perfluorooctanoic acid (PFOA) of 0.2 µg/L (micrograms per litre). This may also be expressed as 200 ng/L (nanograms per litre), which equates to 200 parts per trillion.
It specifies a limit for perfluorooctane sulfonate acid (PFOS) of 0.008 µg/L (micrograms per litre). This may also be expressed as 8 ng/L (nanograms per litre), which equates to 8 parts per trillion.
It specifics a limit for perfluorohexane sulfonate acid (PFHxS) of 0.03 µg/L (micrograms per litre). This may also be expressed as 30 ng/L (nanograms per litre), which equates to 30 parts per trillion.
It also specifies a limit for perfluorobutane sulfonic acid (PFBS) of 1.0 µg/L (micrograms per litre). This may also be expressed as 1000 ng/L (nanograms per litre), which equates to 1000 parts per trillion.
Source: Water Services Association Australia (WSAA) fact sheet - PFAS and the water sector, June 2025.
South East Queensland’s drinking water is safe to drink and continues to meet the standards set by the ADWG.
Any PFAS queries relating to public health should be direct to Queensland Health on 13HEALTH (13 43 25 84).
For public health enquiries, call Queensland Health on 13HEALTH (13 43 25 84). You can also find more information here.
For more information on The Australia Drinking Water Guidelines, visit The National Health and Medical Research Council.
For more information on PFAS, visit the Water Services Association of Australia.